The reports on TIM Plus are incredibly easy to understand. Information is summarised using clear, simple graphs and tables. These are completely interactive allowing you to reorder and drill up and down through information in seconds. TIM Plus isn't just about collecting call data; it’s about allowing you to consume it easily!
Here's a list of the built-in reports available in TIM Plus. Each one can be run for any part of your organisation, filtered by any criteria you choose. And remember, they can be tweaked - or completely rewritten - to suit your individual needs.
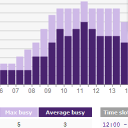
This report allows you to break down each business day into half-hour periods, showing the maximum and average number of telephone lines in use in any particular half-hour.
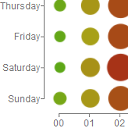
Provides a clear, hour-by-hour graphical representation of your call volumes for each day. Drill down into any hour to see a detailed breakdown of calls by type for that hour.
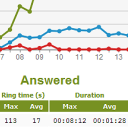
Breaks down your working day into half-hour segments and details important information about your calls. You get a clear graphical representation of how many outbound, answered and abandoned calls you've made.
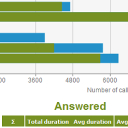
Allows you to see call summaries for each call type, inbound, outbound and missed calls for all of your organisation or for any particular group or section.
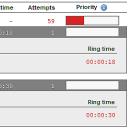
Analyse your missed calls in more detail to see which callers have and haven't been responded to.
Results are arranged into two sections, 'Missed' and 'Handled', showing calls that were never responded to and those that were.
Each missed call is also given a priority depending on how many times and how often a caller attempted to make contact.
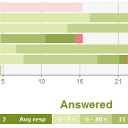
Allows you to define your own target response times and quickly assess how your organisation, your departments and even individual users meet these pre-determined target.
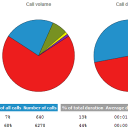
Includes graphical pie charts by volume, duration and cost, along with a table containing complete information about where, geographically, you're making your calls to.
Calls are classified by their tariff band, e.g. local, national, mobile, international, etc.
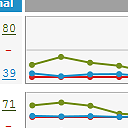
The Call Volumes allows you to get a complete picture of your call volumes by site, group or user.
This drillable report provides a clear, graphical and tabular representation of your outbound, answered and abandoned calls, broken down into hourly blocks.
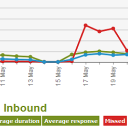
Provides a summary showing the total volume of all inbound, outbound and lost calls for each day.
It's ideal for identifying call volume trends, and very quickly highlights your busy days, allowing you to more effectively plan your staffing requirements.
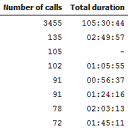
Shows a top-ranking list of the most frequent calls you make and receive. You can use this information to identify abuse and to assist in your decision-making about how to call common destinations, for example, by installing private links between branch offices. The information can also assist you when negotiating call rates with your network provider(s).

This report shows how quickly your inbound call traffic is being answered compared to pre-defined answer time thresholds.
You can compare data by year, month, day or hour, and a visual indication is shown of how many calls were answered inside each threshold, alongside tabular data.
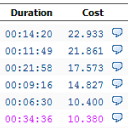
Quickly identify your top calls. Top calls are defined as the highest in terms of cost or duration.
This is useful for identifying telephone abuse; you can instantly see who's making the most expensive types of call, such as those to premium-rate services. You can also identify who's spending longest on the phone.
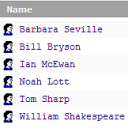
Identifies the volume of calls your users are making and taking from both inside and outside your company.
The report is fully drillable, enabling you to explore calling patterns as you see them, from site level, all the way down to individual user.
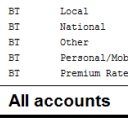
This report produces a summary or list of all calls, grouped by the account code(s) that were used to make them.
It's great for allocating costs to customers, cost centres or individuals.
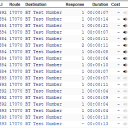
For compliance with local data protection regulations, this report provides a journal of all calls to and from a particular person's phone number, with the ability to destroy all such records, including their associated voice recordings.
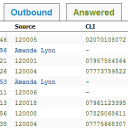
When used in conjunction with call recording, this Random Call Selection report provides a perfect tool to select calls at random for spot-checking purposes.
Annotate, score, or listen to each of the calls that the report produces.

TIM Plus includes call scoring as a standard feature. Users can create their own score cards and rate any call for evaluation purposes. The scores can be based on any combination of "yes/no" answers, "range" answers (e.g. between 1 and 100) and multiple choice.
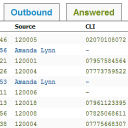
If you're looking for very specific types of calls then this report allows maximum flexibility. You specify your search criteria from any of the fields available, including CLI and LCR codes, to narrow down your search and quickly find the information you're looking for.
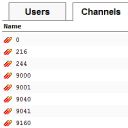
Identify those users and channels inside your organisation that haven't made or received telephone calls over a given period of time.
The Phone Bill report is primarily for use in situations where you need to produce a telephone bill for a client, or group of clients. For example, in a business centre, a hospital, or other organisation with a front-of-house function and where a client may use your telephony services, for which you need to recoup the costs.